Predictive Analytics for Employee Engagement: Guide
Spot disengagement early with clean job-related data, simple explainable models, privacy rules, and manager action plans.
Christian Thomas

Predictive Analytics for Employee Engagement: Guide
You can spot disengagement before it turns into burnout or turnover. The article’s main point is simple: I use workforce data to find early risk, set strict privacy rules, keep models easy to explain, and tie every risk score to a human response. That matters because replacing one employee can cost 50% to 200% of annual salary, and even one exit can disrupt frontline work.
If I were to boil the whole guide down, it would be this:
- Start with clean, job-related data like attendance, training activity, pay timing, recognition patterns, and team survey trends
- Look for patterns over time, often across a 90-day window, instead of reacting to one bad week
- Set rules before scoring anyone so staff know what is collected, who can see it, and how it will be used
- Use simple models first like logistic regression, decision trees, or a plain risk score
- Check bias and accuracy on a schedule with time-based testing, calibration checks, and group-level error reviews
- Turn scores into manager actions like stay interviews, workload reviews, schedule changes, and check-ins
- Track outcomes for 6 to 18 months to see if those actions reduce turnover and improve team stability and role fit
- Retrain at least every six months and review drift, access, and staff feedback
What I like about this approach is that the forecast is not the end point. It is just the prompt. The manager response is what changes the outcome.
A few numbers from the guide stand out:
- High risk: 70%+
- Medium risk: 40% to 70%
- Low risk: Below 40%
- Manager response for high risk: within 48 to 72 hours
- Warning sign for model drift: PSI above 0.25
- Minimum group size for survey reporting: 5 to 10 employees
Quick comparison
| Area | What the guide says to do | Why it matters |
|---|---|---|
| Data | Use HRIS, payroll, attendance, LMS, recognition, and team survey data | Better inputs lead to better forecasts |
| Privacy | Limit access, de-identify surveys, and publish a plain-language notice | Staff trust can hold up |
| Modeling | Start with a simple, explainable model | Managers can understand the result |
| Bias checks | Review group error rates and feature drivers | Helps catch skewed outcomes |
| Action | Match risk tiers to clear manager steps | Scores lead to support, not guesswork |
| Measurement | Compare pilots vs. controls over months | Shows whether actions changed results |
| Maintenance | Retrain every six months or after major changes | Keeps scores from drifting off |
So if you want the shortest possible version, here it is: clean data, clear rules, simple scoring, human review, and steady follow-through. That is the roadmap the article lays out.
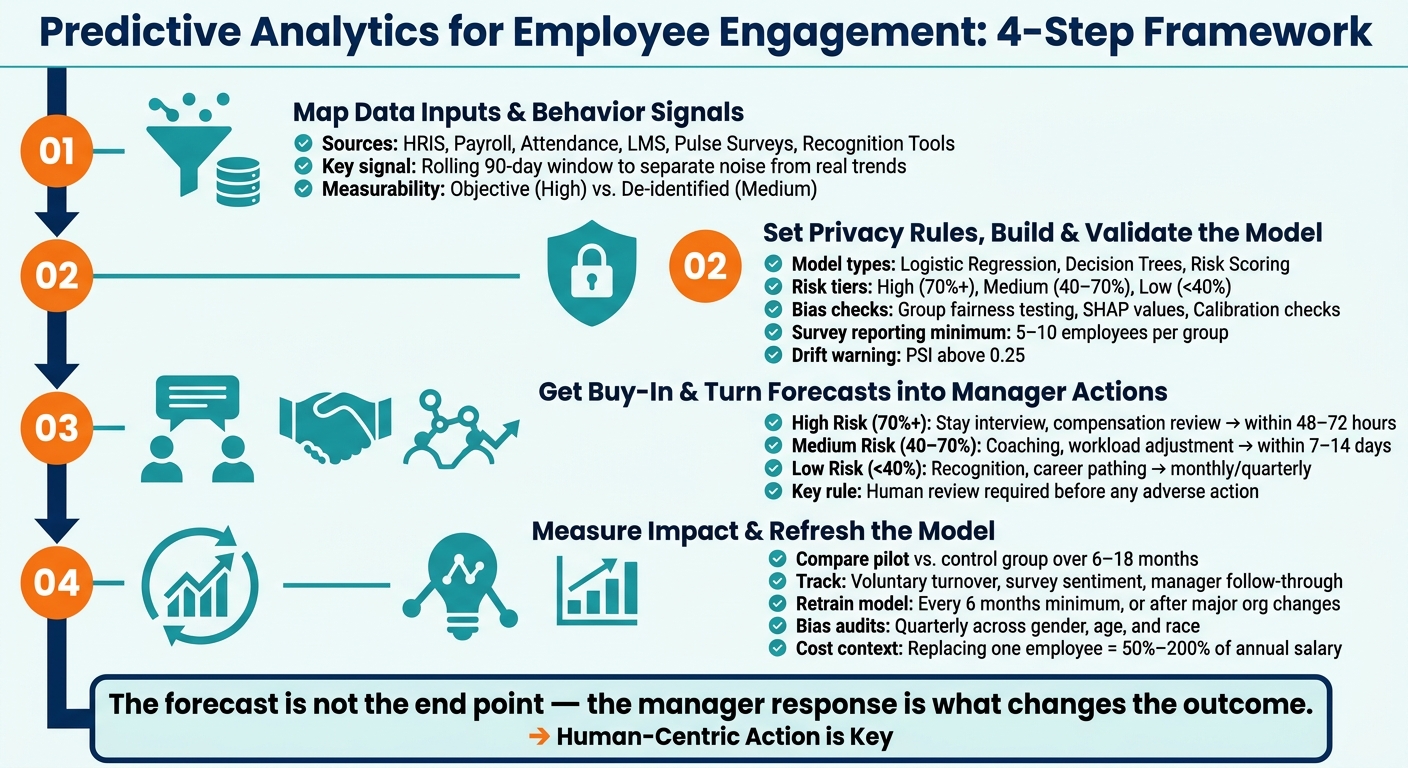
Predictive Analytics for Employee Engagement: 4-Step Framework
Using predictive HR analytics to understand employee engagement | Martin Edwards
Step 1: Map the Right Data Inputs and Behavior Signals
Before you build a model, start by mapping the data you already have. Prediction quality starts with input quality. If the data map is messy, the model will be too. Once you know what data is available, you can decide which signals matter most.
Core Data Sources to Include
Start with the systems already in place. HRIS data can show tenure, role history, and promotion pace. Payroll records can tell you how long it has been since someone got a pay increase. Time and attendance logs can flag unscheduled absences and overtime patterns. Your LMS can show whether employees begin training, finish it, or stop halfway through. Pulse surveys add a sentiment layer, while recognition tools can show whether peer-to-peer acknowledgment is picking up or fading.
| Data Source | Signal | Measurable Signals |
|---|---|---|
| Time & Attendance | Unscheduled absences, overtime spikes | High (Objective) |
| LMS / Training | Completion rates, participation drops | High (Objective) |
| Pulse Surveys | Sentiment trend, response latency | Medium (De-identified) |
| Payroll | Time since last pay increase | High (Objective) |
| Recognition Tools | Declining kudos frequency | Medium (Aggregated) |
Before you combine data from different systems, standardize dates, job titles, and department names. This data works best when it is standardized, deduplicated, and checked for missingness before modeling.
Early Signs of Disengagement in Frontline Settings
In frontline roles, disengagement tends to show up as a pattern, not a one-off event. You might see slower responses to schedule changes, less involvement in team check-ins, weaker learning activity, more unscheduled sick days, or fewer signs of peer recognition. A rolling 90-day window helps separate random noise from a real trend [4][6].
There are other clues too. Open-ended comments may grow more negative over time. Workload anomalies can also stand out, like a sudden spike in overtime compared with that employee's usual baseline [6][8]. The point is to spot risk early, not to overreact to one isolated event.
Clean the Data Before You Build Anything
Messy data leads to shaky predictions. And shaky predictions make managers stop trusting the model. Once that trust is gone, the model stops being useful for frontline action.
Before modeling, handle five basic tasks:
- Remove duplicate records
- Define each metric the same way across departments
- Treat missing values in a consistent way instead of deleting records
- Document who owns each data source
- Keep team sentiment separate from individual records [4][2][3]
Aggregate pulse surveys at the team level. Track measurable signals at the individual level [2][3][4].
A skipped performance review may look like a data gap at first glance. But it can also point to friction in the manager relationship, which means it belongs in the model instead of the discard pile [6][4].
Next, set privacy rules and bias checks before putting any model into production.
Step 2: Set Privacy Rules, Build the Model, and Check for Bias
Privacy and Ethics Rules to Set Before You Start
Set the ground rules before you score anything.
Use only job-related data, block intrusive monitoring, and publish a plain-language notice that explains what you collect, how scores are used, and who can see them. If frontline staff think this is surveillance, trust disappears fast. That’s why the guardrails need to be easy to see and hard to bend.
Survey responses should be de-identified by default. Pulse survey participation should stay voluntary, and nonparticipants should be left out of individual recommendations. On the access side, use Role-Based Access Controls (RBAC) so individual scores are limited to HR partners, while managers see only team-level trends. Report survey data only when groups reach 5 to 10 employees [10].
Once those access and reporting rules are in place, move to the simplest model that answers one clear engagement question.
Choose a Simple Model Tied to a Clear Question
Start with the question, not the algorithm.
Pick one narrow, answerable question first, such as "Which employees are at high disengagement risk over the next 90 days?" That gives the model a clear job to do. It should help managers spot risk early enough to adjust workloads, schedules, or support before things slide.
Start with logistic regression or a decision tree [6][7]. These models are transparent and easier to explain to a skeptical manager. If you’re in a smaller organization without a data science team, a transparent risk-scoring framework can work too. You can weight the same work-related signals and still get results people can use.
After the model is built, the next step is simple: check whether it still works over time and whether it treats employee groups fairly.
Validate Results and Check for Bias
Once the model runs, test whether it predicts future disengagement with both accuracy and fairness. Use a time-based split: train on older data, then validate on later data [6][7]. That mirrors how the model will perform in production instead of giving you a polished number that falls apart later.
Then look for bias. A biased model points managers at the wrong people or teams, which creates harm fast. Remove protected attributes from training, then compare error rates by gender, age, role, and location [6][9]. If one group gets flagged much more often without a work-related reason, dig into it.
Tools like SHAP values help you see which features drive each prediction, which makes it easier to spot proxy variables [6][11]. In plain English, this helps you catch cases where the model seems neutral on the surface but is leaning on signals that stand in for protected traits.
Use low-, medium-, and high-risk tiers instead of binary labels. Also calibrate scores so predicted probabilities line up with observed outcomes [6].
| Validation Check | What It Catches |
|---|---|
| Temporal split testing | Prevents inflated accuracy from data leakage |
| Group fairness testing | Flags unfair outcomes across protected groups |
| SHAP value review | Reveals proxy variables masking bias |
| Calibration checks | Confirms predicted probabilities match real outcomes |
Step 3: Get Staff Buy-In and Turn Forecasts into Manager Action Plans
Explain the Program in Plain Language
If employees don't trust the model, they won't use it. That's the whole game.
So present the program for what it should be: a support tool for managers, not a system built to watch people. A one-page AI Use Notice helps here. It should spell out what data is collected, who can see it, how long it's stored, and how scores will be used to support staff [3][2].
Just as important, say what is not part of the program. Rule out keystroke logging, always-on audio or video monitoring, and facial recognition in writing. Stick to de-identified, job-related signals, and report only team-level results for groups of five or more [2][6].
Managers also need a clear read on what the dashboards mean. Train them to treat the data like a guide for better conversations, not a final judgment on someone's worth. Show the main drivers behind each risk score so they have a better starting point when they sit down with an employee [6][9].
Once people understand the purpose, the next step is simple: turn the forecast into actions managers can actually take.
Match Risk Tiers to Specific Manager Actions
Give managers a response plan that feels simple and usable, not like a policy binder they'll never open.
| Risk Tier | Recommended Actions | Owner | Timeline |
|---|---|---|---|
| High Risk (70%+) | Stay interview, compensation review, workload redistribution, or faster development plan | Direct Manager & HRBP | Within 48–72 hours |
| Medium Risk (40%–70%) | Targeted coaching, workload adjustment, check-in with the manager's manager, or peer support | Direct Manager | Within 7–14 days |
| Low Risk (<40%) | Standard recognition, career pathing discussion, regular 1:1s | Direct Manager | Monthly or quarterly |
The score should open the conversation, not close it. Any adverse action should require human review first [4][3][11].
Use Tools That Help Managers Have Difficult Conversations
Spotting that someone is at high risk is one thing. It is often the first step in burnout prevention. Knowing how to talk about it without making the moment awkward or tense is something else.
This is where a lot of engagement programs get stuck. A manager gets a warning flag, but no clear way to handle the follow-up talk.
HR suites track workforce data. Survey tools track sentiment. And Personos helps managers turn risk signals into better conversations.
Next, measure whether those actions improve engagement and refine the model on a set schedule.
Step 4: Measure Impact, Improve the Model, and Wrap Up
Track Outcomes After Interventions
After managers act on a forecast, you need to check what happened next. Otherwise, a risk score is just a guess.
Compare a pilot group with a matched control group over 6 to 18 months [6][4]. For short-term performance changes, use before-and-after reviews over 30 to 90 days. For retention, matched-control analysis over 6 to 12 months gives you a better read on whether anything changed in a meaningful way [3][6].
Track both early signs and bottom-line outcomes:
- Retention: voluntary turnover rate and retention of flagged high-risk staff [6][3]
- Leading indicators: survey participation, response latency, sentiment slope, and unplanned absence trends [3][1]
- Manager follow-through: whether the manager completed the planned action and whether the employee's risk score changed [6][5]
Look at frontline outcomes too, not just broad HR numbers. That includes shift stability, caseload continuity, and check-in follow-through. The goal is simple: see whether manager actions moved the early signals and the final outcomes [3][6].
It also helps to close the loop in a very direct way. If the system recommends a stay interview, record whether it actually happened and whether the employee's risk score changed after that [6][5].
For the model, keep an eye on AUC-ROC, precision, recall, and calibration. Those metrics show whether the forecasts still work and whether the scores stay in line with what happens in practice [6][7].
Replacing one employee can cost 50% to 200% of annual salary [5]. So even small retention gains can make the spend worth it.
Refresh the Model and Governance on a Set Schedule
If scores start to drift or lose accuracy, retrain the model on a set schedule. Work conditions change. Teams change. Leaders come and go. Policies shift. Because of that, retrain the model at least every six months, and do it sooner after restructurings, leadership changes, or policy updates [4][6].
Watch for two kinds of drift:
- Input drift: when data distributions change
- Prediction drift: when the link between variables and outcomes changes [6]
A PSI above 0.25 is a warning sign and means it's time to retrain [7].
Run bias audits every quarter across gender, age, and race [3][6]. Also review who has access, what updates were made, and what employees are saying about the program. If staff don't trust it, the whole effort starts to wobble [2][10].
Conclusion: A Practical Roadmap for Ethical Engagement Forecasting
Predictive analytics only works when it's tied to action, review, and retraining. Start with the right data. Set privacy rules before building anything. Be open with staff about what you're doing. Then connect risk scores to clear support actions.
The point isn't prediction on its own. The point is giving people help earlier, while there's still time to make a difference.
FAQs
How much data do we need to start?
You don't need a massive historical database. But you do need high-quality data.
For a pilot like predicting turnover hotspots, aim for 12 to 24 months of stable HRIS and payroll data. Add the last 12 months of performance and leave records.
Start with one use case, such as onboarding or early turnover. Then use data you trust, like:
- tenure
- compensation
- pulse survey results
That keeps the project focused and gives you a cleaner starting point.
What data should never be used?
Never use data that puts privacy or trust at risk, especially surveillance-based data. Stay away from sensitive information without clear consent, data that isn't properly anonymized or aggregated, and any data that isn't needed for the stated purpose.
The same goes for small teams. Even if names are removed, data can still point back to a specific person when the group is tiny. That's a line you don't want to cross.
Predictive analytics should help employees grow. It shouldn't be used for punishment, invasive monitoring, or constant tracking.
How do managers act without overreacting?
Managers should treat predictive outputs as probability signals, not hard orders. A flagged case doesn't mean action is automatic. It means the situation deserves a closer look.
Explainable AI tools like SHAP or LIME can help by showing the main factors behind a flagged case. That extra context matters. It gives managers a clearer sense of why something surfaced before they respond.
To keep decisions steady and fair, teams should use human-in-the-loop review along with simple playbooks. That way, responses stay measured instead of reactive.
Personos can also help managers respond with more empathy. It can support tailored interventions with situation-specific guidance and personality-aware insights, which makes each response feel less generic and more suited to the person in front of you.