Cross-National Big Five Scores: Language Comparison
Language, scale use, and sample mix can shift Big Five averages—don’t treat cross-language gaps as proof of real personality differences.
Rachel Johnson

Cross-National Big Five Scores: Language Comparison
You should not treat cross-language Big Five score gaps as proof of personality differences. A person can score differently in English vs. Spanish, or English vs. Korean, even when their underlying traits stay about the same.
Here’s the short version:
- Language can shift average Big Five scores
- Rank order often stays more stable than raw scores
- Mean score comparisons across countries need scalar invariance, not just translation
- Sample makeup can distort country averages
- Small gaps, such as about 0.3 standard deviations or less, need extra care
A few facts stand out:
- Spanish-English bilingual studies often find higher Extraversion, Agreeableness, and Conscientiousness in English
- Some studies also find lower Neuroticism in English, though results are not identical in every sample
- One NEO PI-R study reported that country mean differences were 8.5 times smaller than differences between two random people in the same sample
- Tools like the BFI, BFI-2, NEO-PI-R, HEXACO-100, and Mini-IPIP often show similar five-factor structure across languages, but mean-score comparability is less consistent
If I were using these results in coaching, HR, or leadership assessment, I would keep four checks in front of me:
- What norm group was used?
- What language and version did the person take?
- Is there invariance or validation data for that version?
- Is the score gap large enough to matter?
A simple way to think about it: cross-national Big Five scores are estimates shaped by language, scale use, and sample mix. They can help, but they do not give a clean read on “national character.”
Personality in Cross-Cultural Perspective | Chapter 32 – Cambridge Personality Psychology
Quick Comparison
| Area | What the article says | What I would do |
|---|---|---|
| Translation | Same wording does not always mean same measurement | Check published validation for that language |
| Invariance | Configural and metric are common; scalar is less steady | Avoid raw mean comparisons without scalar or partial scalar support |
| Bilingual testing | Scores can drift by language | Treat shifts as score drift, not instant personality change |
| Country averages | Within-country differences can exceed between-country gaps | Focus on the person, role, and local norm group |
| HR use | Cross-country comparisons can be misread in talent decisions | Pair scores with behavior, context, and sample checks |
So the core message is simple: use cross-language Big Five results with care, and read them as context-sensitive rather than fixed facts.
How Researchers Test Whether Big Five Scores Can Be Compared Across Languages
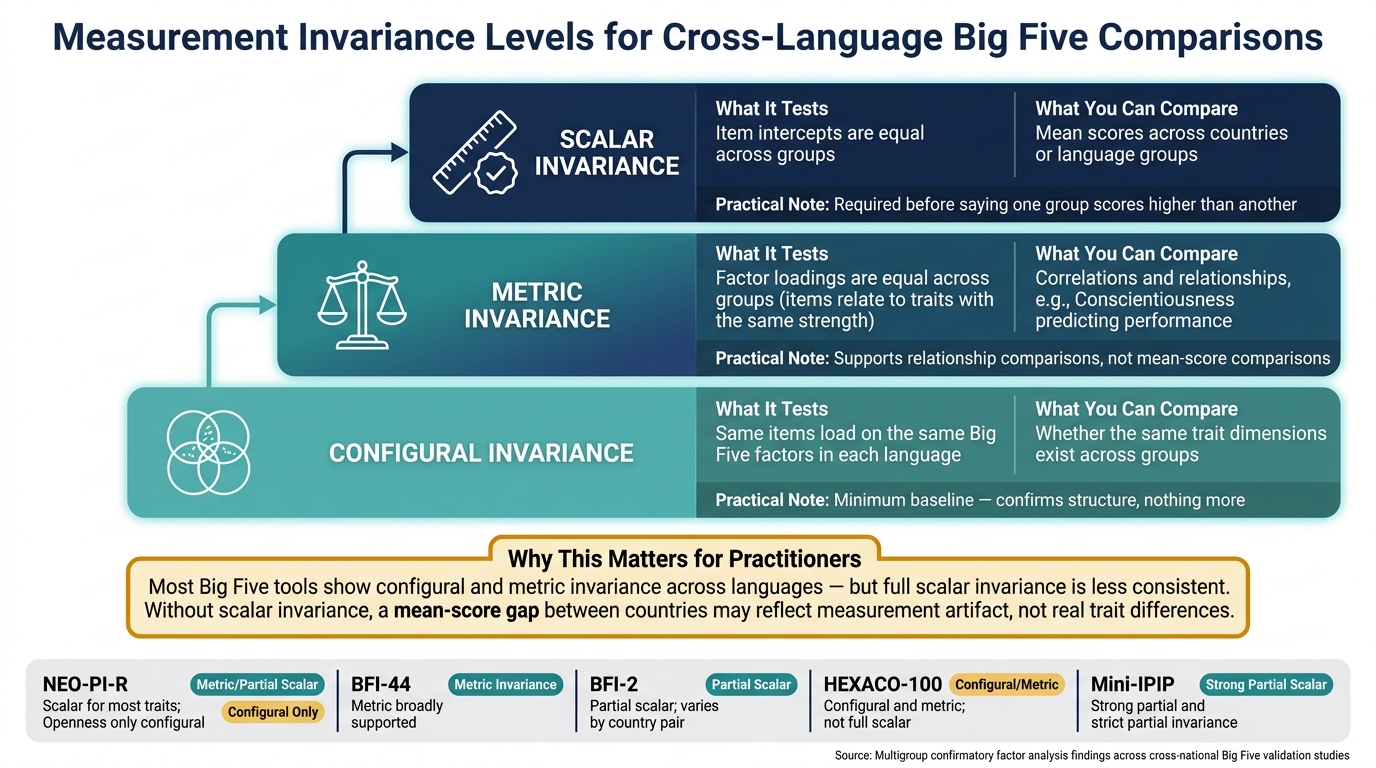
Big Five Score Comparability Across Languages: Invariance Levels Explained
Before comparing Big Five mean scores across languages, researchers first test measurement invariance. In plain English, they want to know whether a translated scale is measuring the same traits in the same way. For coaches and HR leaders, this matters a lot. It helps determine whether a score gap between countries should shape development decisions, or whether that gap is just noise from the measurement process.
Researchers usually test this with multigroup confirmatory factor analysis. They start with a basic model, then add stricter constraints step by step. At each stage, they check whether the model still fits well enough.
What Configural, Metric, and Scalar Invariance Mean in Practice
Each level allows a different kind of comparison.
| Invariance Level | What It Tests | What You Can Compare |
|---|---|---|
| Configural | Same items load on the same Big Five factors in each language | Whether the same trait dimensions exist across groups |
| Metric | Factor loadings are equal across groups (items relate to traits with the same strength) | Correlations and relationships involving traits, such as Conscientiousness predicting performance |
| Scalar | Item intercepts are equal across groups | People at the same trait level should get the same average observed score |
Here’s the key point: a similar factor structure is only the first step. It shows that the same five dimensions appeared in both languages, but that’s all it shows. If you want to say one group actually scores higher on a trait than another, you need scalar invariance, or at least a sound partial invariance model.
Without that, a score gap might not reflect a real trait difference at all. It could just be a measurement artifact. That’s a big deal, because a country-level difference can look meaningful on paper while resting on shaky ground.
What Studies on the BFI, BFI-2, NEO-PI-R, and Other Major Measures Tend to Find
Across the main Big Five measures, one pattern shows up again and again: structural similarity is often strong, but full mean comparability is less steady. For practitioners, that’s the line that matters. It tells you when mean comparisons are on firmer ground and when they need extra caution.
| Instrument | Language/Country Coverage | Typical Invariance Finding | Practical Recommendation |
|---|---|---|---|
| NEO-PI-R / NEO-PI-3 | 23–36 cultures | Scalar for most traits; Openness only configural | Use for profiling; avoid raw mean comparisons on Openness |
| BFI-44 | 31 countries | Metric invariance broadly supported | Relative profiles are more reliable than cross-country means |
| BFI-2 | U.S., Serbia, 5-language validation | Partial scalar; varies by country pair | Check local validation before cross-national comparisons |
| HEXACO-100 | 16 languages | Configural and metric; not full scalar | Treat mean-level country gaps as tentative |
| Mini-IPIP | English vs. Spanish | Strong partial and strict partial invariance | Cross-linguistic comparisons are cautiously supported |
So what does this mean in practice? A tool may show the same general structure across languages, yet mean scores can still shift depending on the language version, response style, or the makeup of the local sample. That’s why practitioners shouldn’t jump straight from “the model fits” to “this country scores higher.”
Those score shifts are exactly why bilingual and cross-national studies get so much attention. They help show whether differences in scores reflect actual trait variation, or whether the language of assessment is nudging results around.
What the Evidence Shows About Language-of-Assessment Effects
Even when the same Big Five structure shows up across languages, average scores can still shift. That point comes up again and again in bilingual research. The basic pattern is simple: language may move mean scores without changing rank order. For coaches, that matters a lot. A person's relative standing often stays about the same even when the raw score drifts.
Findings from Bilingual Studies Such as English-Spanish Comparisons
Studies with Spanish-English bilinguals often report higher Extraversion, Agreeableness, and Conscientiousness, and lower Neuroticism, in English than in Spanish, with small-to-moderate effects.[2][4][5] A 2024 BFI study found higher Agreeableness, Conscientiousness, and Neuroticism in English, and it also showed that language dominance predicted some of the cross-language gaps.[7]
For coaches, that last point is easy to miss but hard to ignore. The direction of the shift can change based on which language feels more natural or dominant for the person taking the assessment. In plain English, a bilingual respondent does not turn into someone else when switching languages. What changes is often the average score, while relative standing stays steady.
That said, not every study finds the same pattern. Some report weaker effects. Others find differences only for certain traits. So the result depends on the sample and the tool being used.[3][6][8]
Most of these gaps tend to come from three places: translation, response style, and shifts in frame of reference.
Why Scores Shift: Translation, Response Styles, and Culture-Linked Mindset Activation
Three mechanisms explain most score movement.
| Mechanism | How It Affects Scores | What It Means for Interpretation |
|---|---|---|
| Translation nuance | Adjectives and phrases carry different connotations across languages, shifting how respondents map onto the scale | Even professionally translated items may not be psychologically equivalent |
| Response style variation | Acquiescence, extreme responding, and midpoint preference can differ by language community, inflating or deflating average scores | Mean differences may reflect scale-use habits, not trait differences |
| Language-triggered frame shifts | Language can cue different self-concepts and standards of comparison within the same person | A bilingual client may answer from a different frame of reference depending on the language context |
This is where interpretation gets tricky. A higher or lower average score does not automatically point to a deeper trait difference. Sometimes it says more about how the item lands, how the scale gets used, or which mental frame the person is in while answering.
The next question is how to read those gaps without overcalling a country difference.
How to Read Cross-National Score Gaps Without Overinterpreting Them
Even when translation effects are handled, cross-national score gaps can still be skewed by who was in the sample. A country average is a rough snapshot, not a verdict on the people in that country. One NEO PI-R study found that country means were 8.5 times smaller than the differences between two randomly selected people in the same sample.[11] Put plainly, person-to-person variation inside a country can dwarf the average gap between countries.
That matters because language-linked score shifts and sample effects can both bend the picture. And in practice, they often show up at the same time.
Sample Effects That Can Distort Country Comparisons
A country score reflects the sample, not just the country, even when the translation itself is solid. If one sample skews younger, more educated, or more white-collar than another, the comparison can drift off course. This is a common problem when student or professional samples are stacked against general-population samples.[12]
Online opt-in surveys add another layer. They tend to overrepresent college-educated and urban respondents. That alone can move scores in ways that look like country differences but may have more to do with sample makeup. Rural and urban splits are a good example. U.S. research has found that rural Americans tend to score lower on Openness and Conscientiousness and higher on Neuroticism than urban Americans.[9][10] In some cases, that kind of within-country difference can be as large as the gaps people try to explain across countries.
A Practical Interpretation Framework for U.S.-Based Coaches and HR Leaders
For coaches and HR teams, the job is to separate trait signal from sampling noise. Before you read too much into a cross-national difference, check these four things:
- Identify the norm group. See whether scores are benchmarked against general adults, working professionals, students, or leaders. Also check whether the norms are country-specific or pooled.
- Confirm the test language and version. A bilingual client who took the test in a non-dominant language may show score drift tied to language context, not a shift in personality.
- Look for validation evidence. Ask whether the translated version has published reliability data and measurement invariance data.
- Judge the size of the gap. Small gaps, around 0.3 standard deviations or less, should be treated with care, not read as clean trait differences.
The table below shows where interpretation often goes wrong and what a more grounded response looks like.
| Scenario | Main Interpretation Risk | Research-Backed Coaching Response |
|---|---|---|
| U.S. headquarters vs. overseas office scores | Labeling the overseas group as less conscientious from a small mean gap | Check norm group alignment and language version before any culture-level inference |
| Bilingual executive tested in English and Spanish | Assuming personality changed across languages | Treat score shifts as language-linked score drift in stable traits |
| Global leadership program using U.S. student norms | Viewing overseas senior managers as less open or more rigid | Request leader-specific norms; student norms inflate Openness relative to experienced managers |
| Cross-national candidate comparison | Attaching a performance judgment to a small percentile gap | Focus on within-country individual differences and role-specific behavioral expectations |
A small percentile gap should not be turned into a performance judgment. It may reflect sample mismatch, response style, or a translation nuance more than any actual trait difference.
Where Personos Can Help Without Replacing Psychometric Judgment
After those checks are done, coaching tools can help move from profile to action. Personos is a coaching tool that turns validated personality data into live guidance. Its conversational AI uses full personality profiles along with context such as role, history, and organizational dynamics.[1]
That said, no platform replaces psychometric judgment. If a client’s scores come from a different language context or from a non-U.S. norm group, the coach still needs to flag that caveat before using the data in any guidance system.
Conclusion: How to Use Cross-Language Big Five Results Responsibly in Coaching
Big Five factor structures often carry across languages, but mean scores don't always line up. That's a key point. Cross-language comparability depends on measurement equivalence, not translation alone. The wording may match, yet the scores can still move for reasons that have little to do with the trait itself.
In practice, the language of assessment, response style, and sample composition can all shift observed scores without any real change in personality. So when you look at bilingual results, you can't just compare them at face value. They need their own review.
English-Spanish bilingual studies show moderate score shifts, large enough to change how a result gets read if the language context is ignored [5]. That helps explain why country-level gaps should be treated with care.
For coaches and HR leaders, the issue isn't whether these shifts exist. It's how to use the data without reading too much into it. A safer approach looks like this:
- Use instruments with published measurement invariance evidence.
- Prefer local norms when they exist.
- State the language, norm group, and limits in coaching notes and reports.
- Interpret scores through observed behavior, not raw percentiles.
Tools can help when the reading process stays disciplined. Personos can support that workflow by surfacing behavior-aware guidance, but the coach still makes the interpretive call.
Across languages, Big Five results are best read as context-sensitive estimates, not fixed country truths.
FAQs
Why isn’t translation enough?
Translation alone isn’t enough. Personality assessments need more than linguistic equivalence. They also need measurement equivalence across cultures.
Even with the Five Factor Model, raw scores can move around because of sample effects and cross-country differences in how traits are described and expressed. The same score may not mean exactly the same thing in every setting.
In coaching, that means score gaps need a careful read, not a face-value one.
What does scalar invariance prove?
Scalar invariance means a personality construct is measured the same way across groups or languages, so you can compare score levels in a meaningful way.
If it holds, differences in observed scores are more likely to reflect actual differences in the latent trait, not quirks in the measurement tool. In coaching, that kind of equivalence matters because it supports sound interpretation.
How big must a score gap be to matter?
The sources do not give a set numeric cutoff for when a language-based score gap becomes meaningful.
What they do say is a bit more practical: read these gaps with care. The Five Factor Model shows consistency across cultures, but coaches shouldn’t lean on static scores alone.
In a coaching setting, Personos is meant to help make sense of the results with guidance tied to the person’s situation, not just the score on the page.