Big Five Trait Prediction: What Accuracy Scores Mean
Interpret Big Five prediction metrics—correlation, MAE, explained variance, and R²—and separate score accuracy from communication impact.
Nick Blasi

Big Five Trait Prediction: What Accuracy Scores Mean
I wouldn’t trust a Big Five prediction based on correlation alone. Predictions can correlate perfectly with reference scores while putting everyone 10 points too high. Before using a tool, I’d check both its score errors and whether it helps clients.
Here’s what I look for:
- Correlation: Do predictions follow the same patterns or rankings as reference scores?
- MAE: How far off are scores, on average, on the stated scale?
- Explained variance: How much do errors vary? A constant scoring bias can go undetected.
- Test-set R²: Does the model beat the test-sample mean? A negative value means it does not.
Then I check who was tested, how reference scores were measured, whether test participants were kept separate from training, and how errors differ across groups.
My bottom line: <u>score accuracy and better client communication are separate claims.</u> For tools such as Personos, I’d request separate tests of profile scoring, recommendations, safety, and client outcomes, plus clear consent and data-use rules. I’d use trait estimates to guide questions, not label people or decide who gets services.
What Correlation, MAE, and Explained Variance Tell You
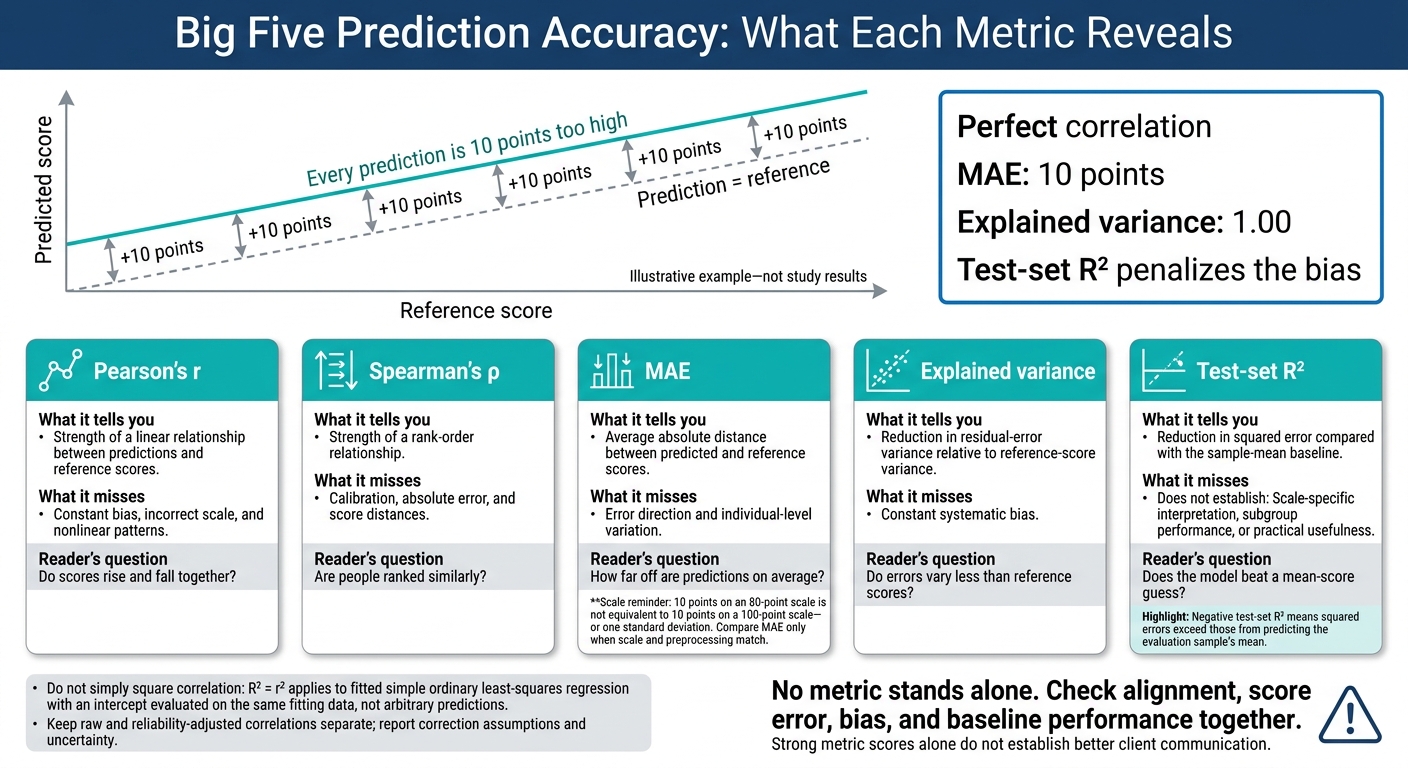
Big Five Prediction Accuracy: What Each Metric Reveals
| Metric | Meaning | Rewards | Misses | Reader’s question | Can it stand alone? |
|---|---|---|---|---|---|
| Pearson’s r | Strength of a linear relationship between predictions and reference scores | Linear alignment | Constant bias, incorrect scale, and nonlinear patterns | Do scores rise and fall together? | No |
| Spearman’s ρ | Strength of a rank-order relationship | Correct ordering | Calibration, absolute error, and score distances | Are people ranked similarly? | No |
| MAE | Average absolute distance between predicted and reference scores | Small average errors in scale points | Error direction and individual-level variation | How far off are predictions on average? | No |
| Explained variance | Reduction in residual-error variance relative to reference-score variance | Low variability in errors | Constant systematic bias | Do errors vary less than reference scores? | No |
| Test-set R² | Reduction in squared error compared with the sample-mean baseline | Lower squared error than the baseline | Scale-specific interpretation, subgroup performance, and practical usefulness | Does the model beat a mean-score guess? | No |
Correlation: Matching Patterns Can Still Miss Score Error
r measures linear alignment; ρ measures rank alignment. Neither tells you whether the actual scores agree.
Keep raw and reliability-adjusted correlations separate. Reliability-adjusted values account for measurement error under specific assumptions. Ask for both values, confidence intervals where possible, and the assumptions behind the correction. Corrected and uncorrected values aren't interchangeable.[8][9][10]
Perfect correlation can still leave every prediction 10 points too high.
Correlation alone doesn't tell you how large the errors are. That's where MAE comes in.
MAE: How Far Predictions Are From Reference Scores
MAE reports error in trait-score points.[5] State the score range first:
An MAE of 10 points on an 80-point scale is not equivalent to 10 points on a 100-point scale - or one standard deviation.
Compare MAE only when the scale and preprocessing match. Report median absolute error and error percentiles alongside it.
R² answers a different question: Does the model beat a mean-score guess?
Explained Variance and Test-set R²: How They Handle Error
Explained variance measures how much residual variation the model removes. R² measures how much squared error it removes compared with predicting the sample mean. Unlike explained variance, R² penalizes constant bias.[4][6][7]
If every prediction is 10 points too high, explained variance is still 1.00 because the errors do not vary. Test-set R² penalizes that error.
On test data, R² can be negative if squared errors exceed those from predicting the evaluation sample’s mean.[6] Report any training-mean baseline separately.
Don't simply square the correlation. R² = r² holds for fitted simple ordinary least-squares regression with an intercept when evaluated on the same fitting data, not for arbitrary predictions.[6] Label training, test, and baseline results separately.
Better client communication is a separate claim. Strong metric scores alone don't establish it.
How to Read Big Five Prediction Studies
Check the Sample, Reference Scores, and Test Design
Record each study’s input, population, reference measure, score scale, and validation design before comparing results. Studies using photographs, interview transcripts, and reading logs aren’t directly comparable simply because they all predict Big Five traits in executive coaching and other professional settings.
Use this table as a comparison checklist, but compare results only when the input type, scale, and validation design match.
Values come from study summaries; - means unavailable in those summaries, not necessarily absent from the full papers.
| Study | Input | Population | Reference measure and scale | Reported metrics | Validation design |
|---|---|---|---|---|---|
| Facial-image study [11] | Static facial images | 12,447 volunteers; 31,367 images | Self-report Big Five; scale - | Conscientiousness: men, r = .360; women, r = .335 | Sex-specific results; participant-level test separation - |
| Semistructured-interview study, 2026 [12] | Interview transcripts | 518 participants | BFI-10 self-report; 1–5 | Conscientiousness: r = .718; agreeableness: r = .631. MAE: openness below 0.7; conscientiousness and agreeableness above 1.4 | Multiple model and prompt runs were reported; no independent external validation was reported |
| Learning-log study [13] | Learning logs | 129 high-school students | Measure and scale - | Conscientiousness: r = .383; R² = .147 | No independent external validation was reported |
Headline correlations tell only part of the story. When a study tests multiple models or prompts, check whether the final performance was measured on untouched data. Internal testing should separate people, not just their posts, photographs, or sessions. Also check whether preprocessing, feature selection, or prompt tuning used test data.
External validation requires a locked model and an independently collected sample. Results for broad trait domains don’t establish accuracy for narrower facets.
The semistructured-interview study reported strong conscientiousness and agreeableness correlations, but MAE stayed above 1.4 on a 1–5 scale.[12]
The learning-log study shows that modest scores can still leave substantial unexplained variation: r = .383 and R² = .147 for conscientiousness.[13]
Check Baselines, Uncertainty, and Subgroup Coverage
Ask for a training-set mean baseline evaluated on the same test participants, along with a suitable label-permutation check. When each person contributes multiple records, permutations must respect participant clusters.
Request confidence intervals and paired comparisons with the baseline. If intervals aren’t available, state that uncertainty wasn’t reported. Statistical significance doesn’t guarantee much practical improvement. And models tested with different scales, samples, or data splits shouldn’t be ranked together.
Check reference-score reliability, observer agreement, score distributions, and subgroup sample sizes. Self-reports are measurements, not perfect ground truth, and restricted score ranges can change correlations. The facial-image study’s sex-specific results don’t establish coverage across age, race, language, or clinical setting.[11]
Before using score accuracy to guide client communication, check whether the sample, input length, and communication setting match your use case. A good average score alone doesn’t show that a model will work in practice.
What Trait Prediction Can Tell Us About Client Communication
Accurate trait scores do not guarantee better rapport, trust, retention, safety, or client outcomes. After checking score accuracy, the next step is to test whether those scores help practitioners communicate better.
| Claim | Evidence needed | What it does not establish |
|---|---|---|
| Calibrated numerical scores | Mean absolute error, bias, calibration plots, confidence intervals, and agreement across score ranges | Does not prove better communication |
| Useful recommendations | Expert review, scenario-based tests, fidelity checks, client and practitioner ratings, and monitoring for harms | Does not prove better client outcomes |
| Better client outcomes | Controlled or carefully matched pilots measuring the outcomes below | Does not prove trait accuracy in every context |
Treat Trait Estimates as Hypotheses, Not Labels
Use profiles to guide questions, not to infer diagnoses, motives, or capabilities. Language, situational stress, and other context can affect communication.
Explain the purpose, seek consent, and be clear about uncertainty. Check suggestions against what you observe and what clients tell you. Let clients decline or correct a profile. Never use personality predictions alone for crisis decisions, risk classification, or service eligibility.
Personos: Profile Accuracy and Communication Impact
Personos shows why communication-support software and trait prediction need separate evaluation. According to its provider, Personos offers Five Factor Model profiles covering 30 traits on an 80-point scale, along with chat, dynamic reports, prompts, and ActionBoard.[1]
An assessment-based profile is different from personality inferred from messages or behavior. These materials do not establish that Personos performs the latter. Request separate validation of profile scoring, recommendation quality, safety, usability, and client outcomes.
Test Communication Support Against Usual Practice
Compare communication support with usual care. Before starting a 6- to 12-week pilot, define the outcomes you’ll measure. Track client-reported rapport and trust, attendance and retention, agreed-task completion and goal progress, practitioner-reported usefulness and workload, and complaints or safety incidents. Also track differences across language, age, race, disability, and other relevant groups.
Use consistent survey questions and record who received support. If randomization isn’t feasible, document baseline differences. Use matched comparisons or a before-and-after design, and state the limitations clearly.
Before entering sensitive case information, review informed consent, role-based access, encryption, retention and deletion rules, audit logs, vendor contracts, breach procedures, and model-training data use. Enter only necessary information and set a clear rule for stopping unsafe recommendations.
Review results across relevant client groups where sample sizes permit. Completed tasks and positive staff feedback show use, not client benefit.
Conclusion: Check Score Accuracy and Client Results Separately
High correlation can hide poor individual predictions. Correlation shows whether scores move together. MAE reports average error in score units. R² shows whether the model beats a mean-score baseline.[2][3]
These metrics alone do not prove that individual scores are dependable or that the tool improves client communication.
Before buying, ask for a short evidence packet that includes:
- The exact Five Factor Model score scale and reference measure; held-out results for each trait covering correlation, MAE, explained variance, and R²; and the test-sample mean baseline.
- Uncertainty intervals, calibration checks, error distributions, and performance for the populations and languages you serve.
For communication tools, also require written policies covering consent, access, retention, deletion, security, and model training. Ask for controlled comparisons with usual practice that report sample size, follow-up, dropout, and client outcomes.
Treat score accuracy and communication benefit as separate claims, each requiring its own evidence. Without that evidence, the claimed benefit remains unverified.
FAQs
What prediction error is acceptable for my use case?
The search results describe Personos’s Five Factor Model, which measures 30 traits on an 80-point scale, and its real-time guidance. But they don’t specify acceptable prediction error thresholds, such as mean absolute error (MAE) or explained variance, or acceptable error ranges for specific uses.
To set your performance target, ask: How far off can a trait score be before it changes your communication decisions?
How can I tell if a trait estimate is reliable for one client?
Look for clear, research-backed reasoning, not just high statistical scores. Strong correlations show patterns across groups, but they don’t guarantee accurate trait estimates for any one person.
Personos shows the traits, situational details, and psychological principles behind its insights. Review the reasoning behind a report or prompt to judge whether the guidance fits that client and interaction.
How can I test whether personality-based guidance helps clients?
Set up a simple outcome study with specific goals for client communication or relationships. Use personality-informed guidance during sessions, and track progress over time with Personos ActionBoard.
Apply trait- and situation-based recommendations consistently, then compare outcomes before and after the guidance. You can also compare different guidance approaches to see how results differ.
Focus on measurable improvements in client outcomes, not just strong correlations in trait predictions. Personos can also provide tailored insights and support follow-through between sessions.